
The GPU Was Already There: Four Silent Bugs in On-Device Training
· 15 min read · 2989 words · Đọc bản tiếng Việt

Inference went to the edge years ago. Training is following the same path because the data people most want to model is the data they least want to upload, and because the hardware to do it is already sitting on their desk.
That is the bet behind AnyLearning, a desktop app that trains vision models locally. No cloud, no telemetry, nothing uploaded. It also means giving up the one luxury every MLOps stack assumes: a fleet you control. My training loop runs on hardware I have never seen and cannot query in advance, and the gap between "it runs everywhere" and "it uses what it runs on" turns out to be where the bugs live.
For two years, every Mac that ran my app had a perfectly good GPU sitting idle on the same die while the training ran on CPU cores. This was not a surprise. Metal support had been on the plan since the beginning; it just kept losing to whatever was more urgent that quarter, and it kept losing because nothing looked broken. The runs finished, the models were fine. They were only three to four times slower than they needed to be, and nobody files a bug against slower.
That is the honest shape of most technical debt: not an oversight, a queue. What finally moved it was that the work got cheap enough to do. I paired with Claude Code through the whole thing, and it did most of the mechanical labour that had made this a multi-week job: the device plumbing across five vendored trainers, the benchmark harnesses, and the long unglamorous measurement runs.
Two days, start to finish. That is the number that still bothers me: the thing I had deferred for two years cost two days once I stopped doing the mechanical parts by hand. Most of those two days went on measuring rather than coding, and that turned out to be the right ratio. Every one of the four bugs below came out of the measurement, and not one of them raised an error. That is the real subject here. Portable performance fails silently, and the failure looks exactly like success.
Every number below comes from four machines that happen to be in this building: an M1 MacBook Air, a laptop RTX 3080, a desktop RTX 2070 and a workstation RTX 3090. One of each. This is not a benchmark or a set of best practices. The ratios are mine, and only the shape of each surprise is likely to repeat on your hardware.
"GPU" meant CUDA and nothing else
The device selection was one function asking one question:
def get_device(prefer_gpu: bool = True) -> torch.device:
    if prefer_gpu and torch.cuda.is_available():
        return torch.device("cuda")
    return torch.device("cpu")
Right on NVIDIA. On an M1 it quietly hands back the CPU while my UI goes on offering a dropdown that says "GPU". Knowing Metal was unimplemented is not the same as knowing the UI was claiming otherwise, and that second part was news to me. Go and check what your own device picker resolves to on every platform you ship to: mine had been overstating itself for two years and no test caught it, because every test asserted the run finished.
What turning Metal on was worth as a speedup against the CPU, first per epoch and then with the same runs timed end to end:
| model type | per-epoch | whole run |
|---|---|---|
| Image classification (3 epochs) | 3.7x | 0.97x |
| Image segmentation | 4.2x | 2.0x |
| Object detection | 1.7x | 1.26x |
Per-epoch is not what your user feels. On the smallest project the speedup does not shrink, it inverts — 98 seconds on Metal against 95 on the CPU. Almost all of it is one gap: "Training complete" to "Model saved" took 60-61 s after a Metal classification run against 20-21 s after the same run on the CPU.
I will not oversell that. Two runs per arm, one machine, Metal always first and no idle control: not enough to rule out "something else was busy". The habit is what matters: time the whole run your user waits for, not the part you optimised.
The design lesson outlived the bug. The user's intent and the machine's capability are two different things and should not share a variable. A person picks Automatic, GPU or CPU; what "GPU" resolves to is a property of the box, decided at runtime, and a project trained on a CUDA workstation has to open on a Mac and ask for the GPU that machine has.
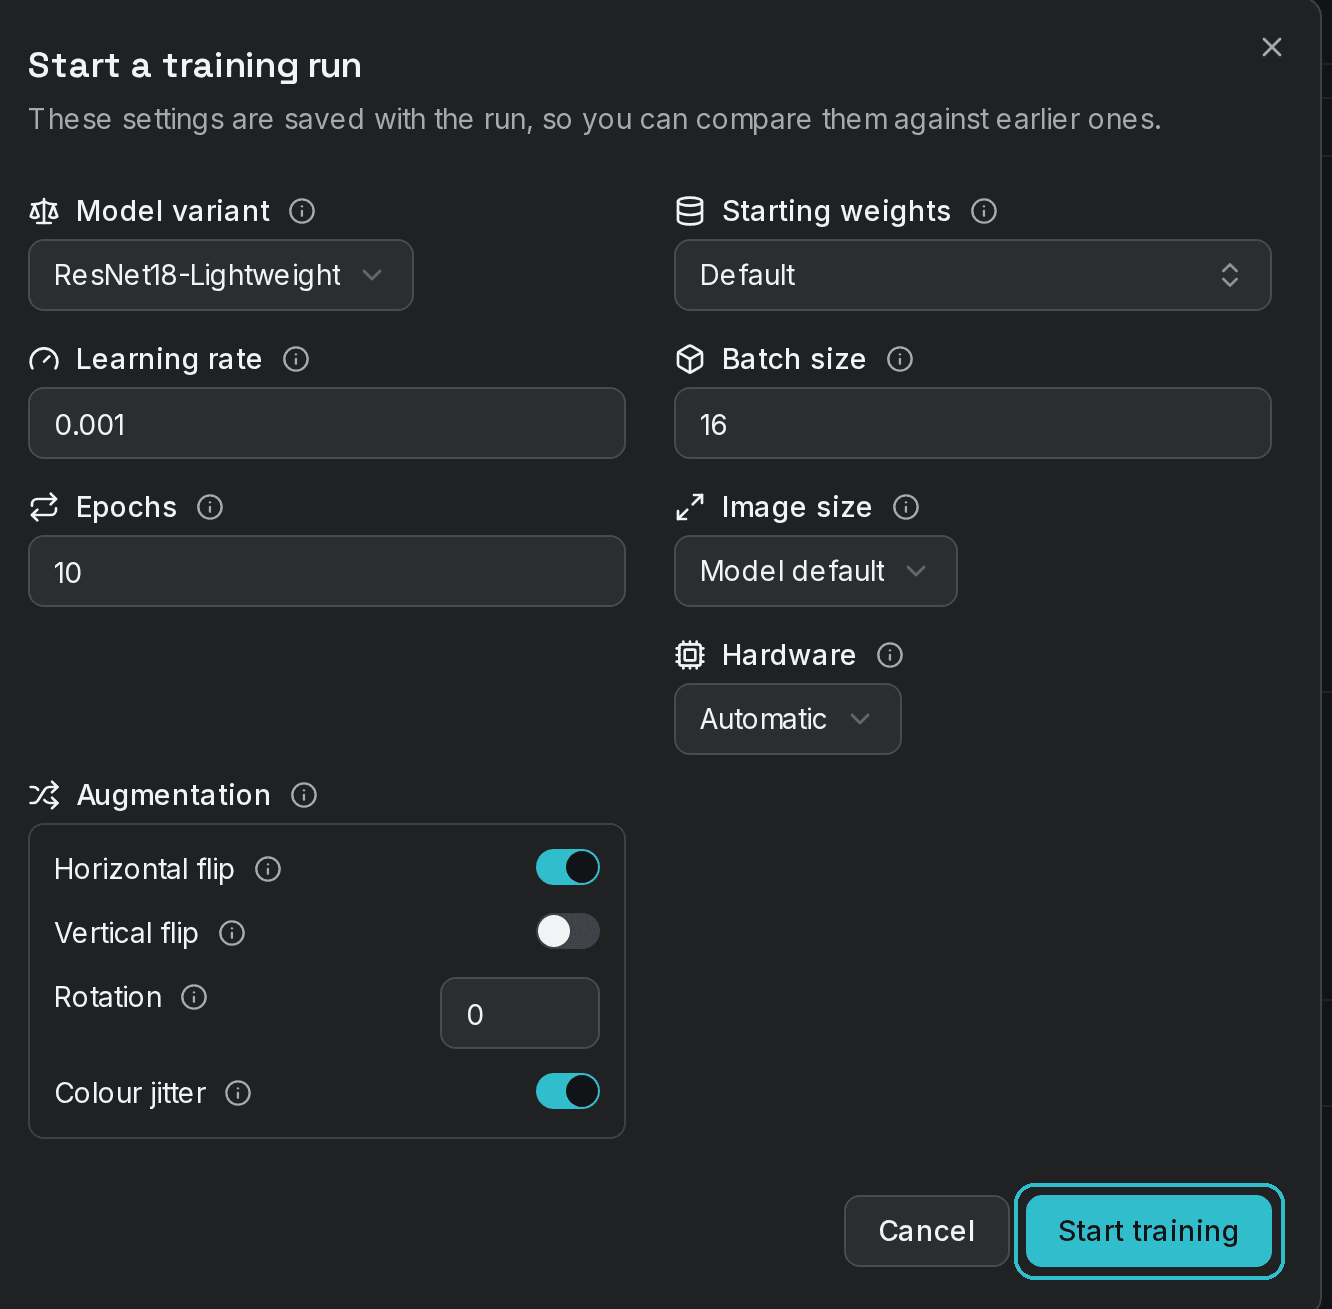
The dialog offers Automatic, GPU or CPU — never "CUDA" or "Metal". Backend names are the machine's vocabulary, not the user's.
The crash with no traceback
Object detection did not simply start working on Metal. The first training iteration killed the process: SIGABRT, no exception, no traceback, nothing naming anything of mine.
Get one line out of it. abort() takes the process down from C++, so Python never gets a turn and the log stays empty. faulthandler installs an OS-level signal handler and still prints:
PYTHONFAULTHANDLER=1 python train.py
Current thread 0x0000000170a6f000 (most recent call first):
  <no Python frame>
Read that literally: the thread that died was not running Python. My forward pass runs on the main thread in Python, so it was not the forward pass. PyTorch runs backward on worker threads that live inside C++ with no Python frame. One line, half the search space gone.
Ask autograd which op it was. The backward graph is walkable from the loss and every node takes a hook, so you can make it announce itself and let the crash mark the spot:
seen = set()

def announce(node):
    if node is None or node in seen:
        return
    seen.add(node)
    # flush=True is not optional: abort() does not flush stdout, and the line
    # you would lose is the last one: the one you need.
    node.register_prehook(
        lambda grads, n=node: print("entering", type(n).__name__, flush=True)
    )
    for nxt, _ in node.next_functions:
        announce(nxt)

announce(loss.grad_fn)
loss.backward()
Last name printed: LinearBackward0. That is NanoDet's Integral head, which ends with F.linear(x, self.project.type_as(x)). Here, self.project is one-dimensional, just the bin indices [0, 1, ... 7]. Every other backend contracts that without comment. Apple's graph compiler builds the wrong multiplication, then rejects its own work:
error: 'mps.matmul' op contracting dimensions differ 4 & 8
note: %2 = "mps.matmul"(%arg1, %arg0)
      : (tensor<1x66x4xf32>, tensor<8xf32>) -> tensor<1x66xf32>
MPSGraphExecutable.mm:1232: failed assertion `original module failed verification'
tensor<8xf32> is project, correctly. tensor<1x66x4xf32> is not the input; it is the output shape, taken as an operand. The failed assertion calls abort(), which is why there was nothing to catch.
Saying the same thing with torch.matmul fixes it, and is bit-identical on CPU and CUDA with byte-identical exported ONNX, which is what made it safe to patch a vendored model. If a crash gives you nothing, your first job is not to fix it but to get one line out of it.
Sometimes the GPU is the wrong answer
The interesting part of hardware portability is not making everything run on the accelerator. It is knowing where the accelerator loses, and being willing to say so in the product. Two of my five trainers never get Metal, and that is a decision rather than a gap: shipping an option that quietly does neither of the things it promises is worse than not shipping it.
Instance segmentation would train on wrong numbers. torchvision's Metal roi_align over-accumulates gradients in the backward pass: 2.96x inflation at 8 regions of interest and 191x at 512, against the CPU reference. The forward pass is exact, so nothing looks wrong until the model does not learn. There is a merged fix from July 2026 that is in no released torchvision, pre-releases included. A merged fix upstream is not a fix you have.
Handpose classification is simply slower on a GPU. It is a small MLP over 63 numbers per sample: 0.173 s per epoch on the CPU against 1.545 on Metal. I filed that as an Apple quirk, and it is not — on a workstation the same model ran 1.4x to 3.1x slower on an RTX 3090 than on that machine's 11th-gen Core i9, never once faster, while every other model type was 10 to 100 times faster on the same card. Below some arithmetic density the accelerator is a tax, not a discount, and that boundary is a property of the model, not of the vendor.
And on Metal, 16-bit is slower than 32-bit: 0.94x for classification, 0.91x for detection, worse again for bf16. Both dtypes work correctly and so does GradScaler; that is not the problem. Autocast inserts a cast per operation, and on a GPU with no tensor cores those casts cost more than the arithmetic saves. bf16 is not native on the M1 either, so a bf16 matmul runs at 0.62x of the fp32 one. (If you are on an M3 or later, do not trust that. Apple added bfloat16 to the GPU in that generation and I have no such machine.)
Two APIs that never said a word
Mixed precision is decided per machine, in one place:
| where | what runs |
|---|---|
| Ampere or newer (compute 8.0+) | bfloat16, no gradient scaler |
| older CUDA cards | float16 with a scaler |
| CPU and Apple Metal | float32 |
On an RTX 3080 the kernels gained 1.42x to 1.91x. The same runs, end to end, gained 1.00x to 1.17x. On my datasets the dataloader is the bottleneck, so halving the compute changes almost nothing. Both numbers are true and they answer different questions. Quote the kernel one and you will be wrong in the bug report where somebody measures the other.
Then two APIs let me ship bugs anyway.
is_bf16_supported() says yes on hardware that can't. On an RTX 2070 it returns True, and Turing has no bfloat16:
def is_bf16_supported(including_emulation: bool = True):
    if torch.cuda.get_device_properties(device).major >= 8:
        return True
    if not including_emulation:
        return False
    return _check_bf16_tensor_supported(device)   # can we allocate one?
The default falls through to allocating a bfloat16 tensor and reporting whether that worked. A 2070 can allocate one, then runs the arithmetic emulated at 0.23x of the fp32 it replaced: four times slower, on the users least able to afford it, with nothing logged. Check get_device_properties(...).major >= 8 instead, which is what torch itself checks before it considers emulation.
My test for this passed, which is the part I took personally. It patched is_bf16_supported to return False and asserted the older-card branch was chosen, mocking away the exact fact that was wrong. A test that stubs the API under investigation can only confirm your model of it.
A gradient scaler skips optimiser steps in silence. On the same 2070, Mask R-CNN's losses stayed finite while the scaled gradients overflowed, and scaler.step skips the optimiser when it sees that. Four of the first seven updates were discarded. The run finished at mAP@0.5 0.13 against float32's 0.31, and the log said nothing, because the code was watching the loss. The signal is the scale itself, which halves on exactly the skipped iterations:
scale_before = scaler.get_scale()
scaler.step(optimizer)
scaler.update()
if scaler.get_scale() < scale_before:
    skipped_steps += 1
The deeper fix was the starting scale. Torch defaults to 65536 and finds its working value by overflowing and backing off — free across thousands of steps, expensive across 60. Starting at 1024 skipped none and scored 0.31. Short fine-tuning runs are not small versions of long ones; they are the regime where the warmup is the run.
How I fooled myself while measuring
One image. An early run reported 0.8108 against fp32's 0.8378 and looked like mixed precision costing three points of accuracy. That validation split has 37 images: 0.8108 is 30/37 and 0.8378 is 31/37. One image changed its mind. Repeating it twice reproduced fp32's number exactly, which felt like proof but was only two samples. Four runs per mode put the spread within a single mode at four times the difference between them.
A control that cannot move. One GPU was busy with another job of my own (not a stranger's, mine), and the timings still looked plausible. What exposed them was the handpose trainer, which contains no mixed-precision code at all: no autocast, no scaler, bit-identical losses in both modes. It measured 12% apart between modes over six runs. A workload that cannot respond to your variable, run beside the ones that can, is the cheapest confound detector there is.
A probe that lied about everything. To measure each model on each device I ran every candidate in a forked child, but a forked child cannot run a backward pass if its parent already has. Torch sometimes raises and sometimes just deadlocks. My first probe concluded every model type failed on every device, on the strength of its own plumbing. Spawn instead.
What shipped since
The device work went out in 0.26.1, and the release after it put the same idea to work on a new task.
0.26.2 made keypoint detection a first-class task: grouped, visibility-aware landmark labelling, COCO/LabelMe/AnyLabeling interchange, RF-DETR training, ONNX export and named landmark inference. The example below is vertebral landmarks on lateral spine X-rays, trained from 80 images. Medical images are exactly the data that cannot be uploaded to somebody's API. That is the point of doing this on the machine that holds them.
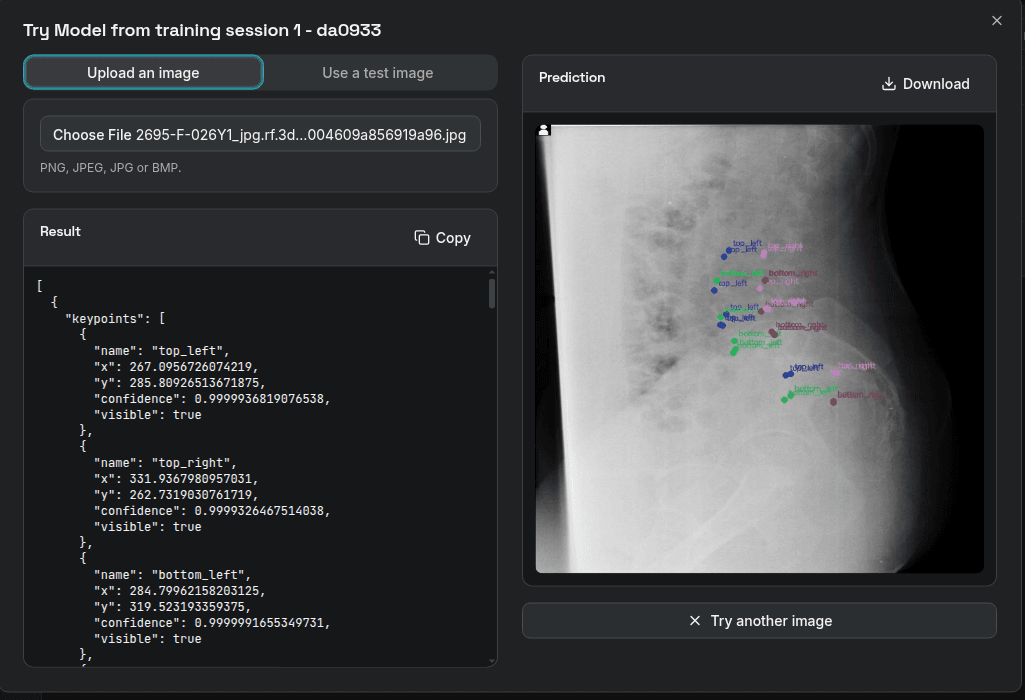
Named vertebral landmarks with per-point confidence and visibility, from a model trained on 80 images — on the machine that holds the X-rays.
Keypoint training also brought this post's theme straight back. Its activation graph is far larger than detection's, and batch eight reproducibly exhausts shared memory on a 16 GB M1. Version 0.26.3 therefore caps the batch size at 2 on Apple GPUs, server-side rather than in the dialog, because saved jobs and older clients exist and the machine's limit is not the UI's to enforce. CUDA and CPU keep whatever was asked for, and the log says what happened:
Reducing keypoint batch size from 8 to 2 for Apple Metal memory safety.
Where this goes
Four things in a training loop belong to the machine and not to your code: which accelerator exists, which dtypes it computes natively rather than emulates, where your bottleneck actually sits, and what one validation sample is worth. I had all four answered by a config file that shipped identically to everyone, and all four were wrong for somebody. That is not a bug I fixed; it is a category of bug that grows every time the accelerator landscape gets more varied, and it is getting more varied, not less.
The cheapest defence is to print what your code decided, with the reason, in the log your user already reads:
Mixed precision: bfloat16 (this GPU supports bfloat16, which needs no loss scaling).
Training device: GPU (Apple Metal, Apple M1)
That alone would have caught my original bug years earlier, because somebody would have seen "training on cpu" on a machine they bought for its GPU.
The real answer is to stop guessing from hardware generation altogether. I am building a short benchmark into the product: it runs on the user's own machine, measures the accelerator and dtype that actually win there, stores the result and re-runs when the hardware changes. Static device logic is a bet that you can enumerate the world's silicon from your desk. On-device AI is the moment that bet stops paying, and the software has to learn the machine it woke up on.
What matters
- 1Device and precision are runtime properties of the machine. A config file that ships to every user cannot know them, and a UI that offers "GPU" must resolve it per box.
- 2A SIGABRT with "<no Python frame>" means the fault is on the autograd thread: look in backward, not forward. Prehooks on graph nodes will name the exact op.
- 3A merged upstream fix is not a fix you have. Run the kernel against a CPU reference, because a wrong gradient looks like nothing until the model fails to learn.
- 4Separate the kernel speedup from the end-to-end one. On my datasets the dataloader dominates, and 1.42-1.91x of arithmetic became 1.00-1.17x of wall clock.
- 5torch.cuda.is_bf16_supported() answers True on Turing, which then runs bf16 at 0.23x of fp32. A gradient scaler skips optimiser steps in silence. Neither API raises anything.
- 6Enforce a machine limit on the server, not in the UI. Saved jobs and older clients exist, and they do not know your GPU ran out of memory.
Keep reading
- Plan Once, Then Act: When the ReAct Loop Is the Wrong Harness for Small Local Models
On small local models, the standard ReAct loop has a failure mode nobody warns you about: the model calls one tool, declares victory, and stops. What we measured across 12 GGUF models in EdgeVox, why we added a plan-once dispatcher, and how to decide which loop your task actually needs.
- Building EdgeVox: Chaining STT → Local LLM → TTS Without Touching the Cloud
A first-hand build narrative of EdgeVox, a fully offline voice agent that chains speech-to-text, a local LLM, and text-to-speech on one device. The architecture in plain language, ROS2 integration, the latency budget, and the failure modes nobody warns you about.
- Vietnam's Sovereign AI Conversation Is Stuck One Layer Too High 🇻🇳
Vietnam already has the chips, three meaningful Vietnamese model attempts in flight, and the most binding AI law in Southeast Asia. The conversation about sovereign AI keeps demanding a 70B foundation model. The actual gap is one layer down: open evaluation, license-clean data, compliance-aware specialized models, and on-device runtimes that operationalize Law 134/2025 from March 2026.