# [Concepts] Classification metrics
**Published:** January 1, 2020
**Tags:** Concepts
---
Classification is a basic family of models in machine learning. In very naive logic, people can use **accuracy** to evaluate how good a model is. However, do we really want **accuracy** as a metric for our performance? Actually, there are many metrics to evaluate a classification model depending on our problem in a real situation.
## 1. True Positive (TP), False Positive (FP), True Negative (TN), False Negative (FN), Confusion matrix
Evaluation of the classification performance is based on the number of incorrect and correct test records by the model. These numbers are True Positive (TP), False Positive (FP), True Negative (TN), False Negative (FN). Let's show it in an insightful picture called confusion matrix:
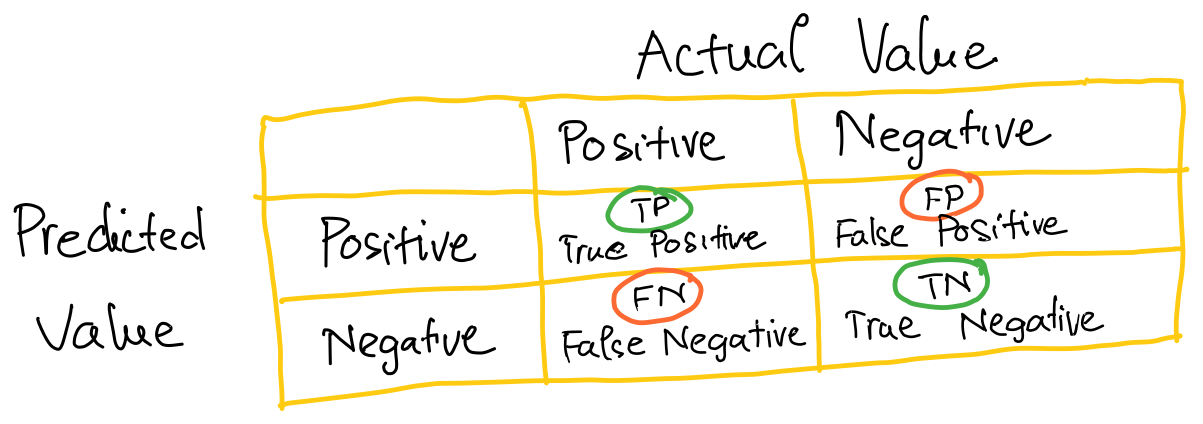
There are 2 correct predicted indicators and 2 incorrect predicted indicators here:
- **True Positive (or TP)**: Observation (ground truth) is positive, and the Predicted value is positive.
- **True Negative (or TN)**: Observation (ground truth) is negative, and the Predicted value is negative.
- **False Positive (or TP)**: Observation (ground truth) is negative, and Predicted value is positive.
- **False Negative (or TN)**: Observation (ground truth) is positive and the Predicted value is negative.
In the classification evaluation, they often visualize the confusion matrix as a table or a photo to illustrate the model performance on the test data. The result from the confusion matrix is used for measuring Recall (or Sensitivity), Precision, Specificity, Accuracy, and the AUC-ROC Curve below.
## 2. Accuracy
The accuracy metric is pretty easy to understand. It is the number of correct predictions over the total number of predictions.
$$
Accuracy = \frac{ Correct_Predictions }{ Total_Predictions }
= \frac{ TP + TN }{ TP + TN + FP + FN }
$$
**When to use?** Accuracy is recommended to be used in the problems where the test data is well balanced. If your data has a imbalanced number of samples between classes, **accuracy** may give an incorrect insight. For example, in spam email classification, assume you have 98 spam emails and 2 not-spam emails in a test set, and your models always give "spam" prediction for all cases, you will have accuracy of 98%. It's a nice number, however it may not give us a valuable measurement of model performance.
## 3. Precision - Recall - Specificity - F-Score
### Precision
**Precistion** is the number of predicted positives that are truly positive samples.
$$
Precision = \frac{ TP } { TP + FP }
$$
**When to use Precision?** Precision is used when we want the model to be very sure about the positive predictions (or we want to minimize false positives).
### Recall (or Sensivity)
**Recall** is the portion of positives that are correctly classified.
$$
Recall = \frac{ TP } { TP + FN }
$$
**When to use Recall?** We use recall when the model needs to capture as many positives as possible. For example, in the massive rapid testing for COVID-19 virus, we don't want to miss any positive case, so we can accept having a high number of false positives. After the rapid test, we may confirm the result with another high precision test, such as the PCR test.
### F1-Score - F-Score
**Precision** and **Recall** are often combined in a single metric to balance both concerns, which is **F1-Score**. **F1-Score** is also called **F1-Measure**.
$$
F_1 = \frac {2 \times Precision \times Recall} {Precision + Recall}
$$
However, the equation of F1 equalizes the factor of **Precision** and **Recall** in the calculation. What if we want to put more priority on Precision or Recall? **Fbeta-Score** was born to solve that problem by introducing the parameter $ \beta $ to control the contribution of **Precision** and **Recall** in F-Score calculation.
$$
F_\beta = (1 + \beta^2) \times \frac {Precision \times Recall} {\beta^2 \times Precision + Recall}
$$
The abovePrecision way of combination is also called [Harmonic mean](https://en.wikipedia.org/wiki/Harmonic_mean).
### Specificity
Another metric that is often used in the medical test is **Specificity**:
$$
Specificity = \frac{ TN } { FP + TN }
$$
**When to use Specificity?** In opposite to recall, **Specificity** is used to maximize the number of correctly predicted negatives over truly negative samples. Specificity relates to the test's ability to correctly reject healthy patients without a condition.
## 4. AUC-ROC Curve
### ROC Curve
ROC (receiver operating characteristic) is the graph showing the performance of the classification model at all thresholds. This curve plots two parameters:
- **True Positive Rate (TPR)** or Recall:
$$
TPR = \frac{TP}{TP + FN}
$$
- **False Positive Rate (FPR)**:
$$
FPR = \frac{FP}{FP + TN}
$$
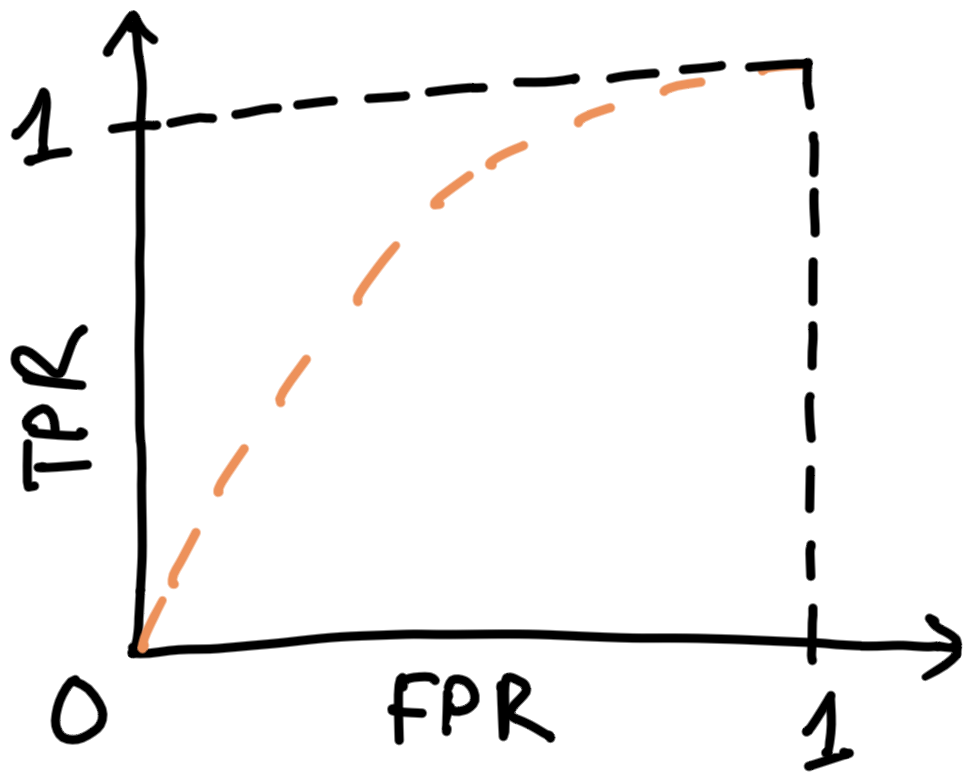 We can use the ROC curve to decide the optimal threshold value to use with our model. The choice of threshold will depend on the situation you apply your classifier.
### AUC
We can use the ROC curve to decide the optimal threshold value to use with our model. The choice of threshold will depend on the situation you apply your classifier.
### AUC
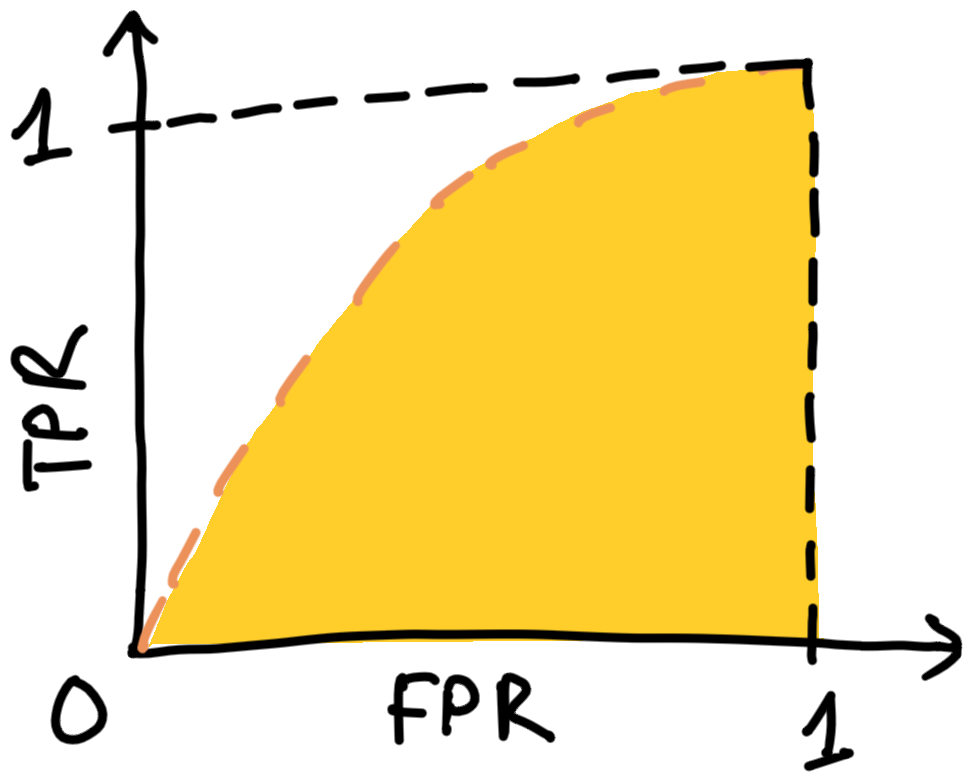 AUC stands for **_Area under the ROC Curve_**. AUC measures the entire two-dimensional area underneath the entire ROC curve from (0,0) to (1,1). You can use integral calculus to calculate this area. AUC ranges in value from 0 to 1. A model whose predictions are 100% wrong has an AUC of 0.0; one whose predictions are 100% correct has an AUC of 1.0.
**Why uses AUC?**
- AUC is **scale-invariant**. It cares about how well the predictions are ranked, it doesn't care about the absolute prediction values.
- AUC is **classification-threshold-invariant**. It measures the quality of the model's predictions irrespective of what classification threshold is chosen.
**Caveats**
- Scale invariance is not always desirable.
- Classification-threshold invariance is not always desirable.
See more [here](https://developers.google.com/machine-learning/crash-course/classification/roc-and-auc).
## References
- https://towardsdatascience.com/the-5-classification-evaluation-metrics-you-must-know-aa97784ff226
- https://developers.google.com/machine-learning/crash-course/classification/roc-and-auc
AUC stands for **_Area under the ROC Curve_**. AUC measures the entire two-dimensional area underneath the entire ROC curve from (0,0) to (1,1). You can use integral calculus to calculate this area. AUC ranges in value from 0 to 1. A model whose predictions are 100% wrong has an AUC of 0.0; one whose predictions are 100% correct has an AUC of 1.0.
**Why uses AUC?**
- AUC is **scale-invariant**. It cares about how well the predictions are ranked, it doesn't care about the absolute prediction values.
- AUC is **classification-threshold-invariant**. It measures the quality of the model's predictions irrespective of what classification threshold is chosen.
**Caveats**
- Scale invariance is not always desirable.
- Classification-threshold invariance is not always desirable.
See more [here](https://developers.google.com/machine-learning/crash-course/classification/roc-and-auc).
## References
- https://towardsdatascience.com/the-5-classification-evaluation-metrics-you-must-know-aa97784ff226
- https://developers.google.com/machine-learning/crash-course/classification/roc-and-auc